Sheets dashboards
Google Sheets to Data Studio: dashboards from the spreadsheets you already use
Connecting Google Sheets to Data Studio is the fastest way for most teams to get a live dashboard, because the data is already in a spreadsheet someone maintains. I help operations, finance and marketing teams restructure those sheets for reporting, automate how data gets into them, and build a Google Sheets dashboard that updates without anyone copying and pasting.
Quick answer
How do I connect Google Sheets to Data Studio?
To connect Google Sheets to Data Studio, add a data source, choose the Google Sheets connector, pick the spreadsheet and the tab, and confirm that the first row holds headers. Data Studio reads each column as a field. The data must be tidy: one header row, one record per row, no merged cells, and consistent dates.
- Sheets built for people to read are rarely built for Data Studio to read.
- One header row and one record per row fixes most Sheets dashboard problems.
- Apps Script can load files into Sheets automatically on a schedule.
- Move to BigQuery when sheets slow down or many sources need joining.
Why do Google Sheets to Data Studio reports break so often?
Because most spreadsheets are designed for people, not for a reporting tool. Merged headers, subtotal rows, a new column for every month, notes typed into number columns and colors that carry meaning all look fine to a human and confuse Data Studio.
The symptoms are familiar: a metric that suddenly reads as text, a chart that double counts because subtotals are included, or a whole report breaking because someone renamed a column header. Data Studio reads columns as fields, so any change to a header breaks every chart and calculated field that used it.
How should I structure a Google Sheet for a Data Studio dashboard?
Keep a raw data tab that is long and narrow, and do the presentation in Data Studio. Each row is one record, such as a transaction, a policy or an order line. Each column is one attribute with one data type.
I usually split a reporting workbook into three kinds of tabs: raw data loaded by automation, small lookup tables maintained by people, and a locked output tab that Data Studio reads. Humans edit only the lookups, which keeps the output stable.
- One header row, with short, stable names that never change.
- One record per row, with no subtotal or blank spacer rows.
- Months as values in a date column, not as separate columns.
- Real dates and numbers, never numbers stored as text.
- An ID column so rows can be joined to other sources reliably.
- Targets and mappings in separate lookup tabs.
What you get
What I build
Scoped and quoted at a fixed price after a free review.
Restructured workbook
Raw, lookup and output tabs designed for Data Studio, with stable headers and correct data types.
Apps Script loader
A scheduled script that picks up files, maps columns, applies rules and appends clean rows.
Load log
A tab recording each load, its row count and any errors, so failures are visible.
Sheets dashboard
A Data Studio report on the output tab, with targets, filters and period comparisons.
Migration plan
A short note on when and how to move heavy data to BigQuery as volumes grow.
How can Apps Script keep a Google Sheets dashboard up to date?
Apps Script runs code inside Google Workspace on a time trigger, so it can do the copying and cleaning a person would otherwise do every week. Typical jobs are picking up new files from a Google Drive folder, parsing them, mapping columns to a standard layout, applying business rules and appending the result to the raw data tab.
This is where most of the time savings come from. The dashboard itself is often quick to build. The hours go into the monthly ritual of downloading, pasting, fixing and checking, and that is exactly what a scheduled script removes. I add a simple log tab so you can see when each file was loaded and whether anything failed.
The script also enforces the rules a tired person skips at month end: rejecting duplicate files, flagging rows with missing IDs, and stopping when a source file arrives in an unexpected layout instead of loading bad data quietly.
What can automating Sheets into Data Studio change? An insurance example
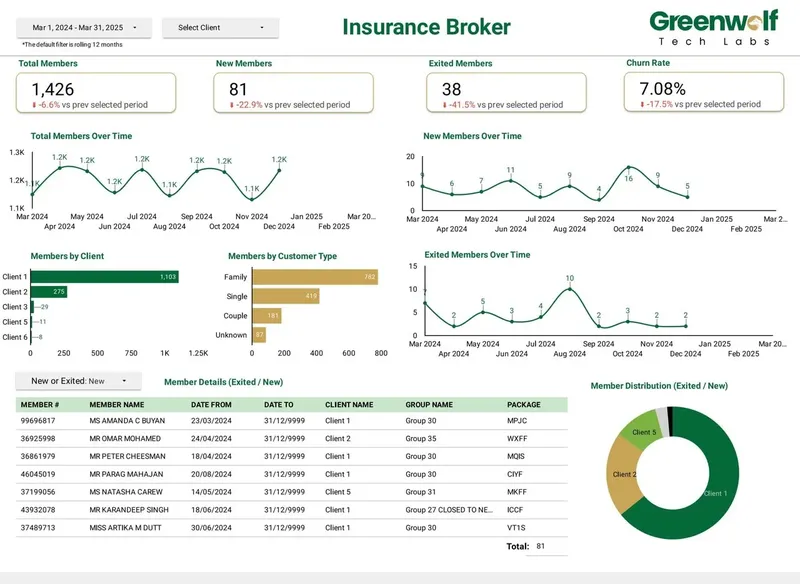
An Australian insurance brokerage I worked with through Greenwolf Tech Labs received messy .xls files from multiple insurers, each in its own format. Someone spent hours each reporting cycle reshaping them by hand.
We built a pipeline where the files land in Google Drive, are mapped into a central Google Sheet, have business rules applied, and feed a Data Studio dashboard. Report time fell from 4-5 hours to under 5 minutes, reporting accuracy rose from about 75% to 99%, and visibility across insurers went from limited to real time, with filters.
Which Data Studio features work well on Sheets data?
Sheets is a flexible-schema source, so a table can use up to 100 dimensions and 100 metrics, far more than GA4 or Google Ads allow. Calculated fields and CASE statements work as usual, and blends can join a Sheet to GA4, Google Ads or another Sheet, up to five sources, with equality joins only.
A common pattern is a small targets sheet blended with live data, so a scorecard shows actual against target. Forecast tables work the same way, which is how actual vs forecast views are often built. Since June 2026, viewers can refresh data manually, which helps when a sheet has just been updated before a meeting.
When should a Google Sheets dashboard move to BigQuery?
Move when the sheet is slow to open, when Data Studio starts returning "too many rows" errors or timing out, or when you need to join more sources than a blend allows. Another sign is when several reports need the same cleaned data and you are maintaining copies of the same sheet.
The move does not have to be all at once. I often keep people-maintained lookups in Sheets and move the high-volume raw data into BigQuery, using scheduled loads. The dashboard keeps its layout, and only its data sources change underneath.
Case study · Insurance brokerage, Australia
From 4-5 hours of spreadsheet work to a report in under 5 minutes
A project I led at Greenwolf Tech Labs. Monthly reports were assembled by hand from inconsistent .xls files sent by several insurers. The files now land in Google Drive, are mapped into one central sheet with the business rules applied, and feed a Data Studio dashboard.
- Report time: 4-5 hours to under 5 minutes
- Reporting accuracy: about 75% to 99%
- Visibility across insurers: limited to real time, with filters
How it works
How a project runs
- 01
Share the sheets
You share the current workbooks and a few example source files.
- 02
Review and quote
I map the data flow and send a fixed price for the restructure, automation and dashboard.
- 03
Restructure
I rebuild the workbook into raw, lookup and output tabs.
- 04
Automate
I write and schedule the Apps Script loader, then test it on real files.
- 05
Build and hand over
I build the dashboard, transfer ownership and record a walkthrough.
FAQ
Frequently asked questions
Does Data Studio update automatically from Google Sheets?
Yes. Data Studio reads the sheet when the report loads, so new rows appear without rebuilding anything. Viewers can also refresh data manually. The sheet itself only updates if someone or something, such as an Apps Script trigger, puts new data into it.
Why does my Google Sheet show numbers as text in Data Studio?
The column probably contains mixed values, such as numbers alongside notes, dashes or currency symbols typed as text. Clean the column so it holds only numbers, then refresh the data source fields so Data Studio reads it as a number.
Can I connect several Google Sheets to one Data Studio report?
Yes. Each sheet or tab becomes its own data source, and you can blend up to five sources with equality joins. For more than that, combine the sheets into one output tab or move the data to BigQuery.
Is a Google Sheets dashboard good enough for a growing business?
Often, yes, for a long time. Sheets handles moderate volumes well when it is structured properly. Move the heavy data to BigQuery when the sheet slows down or reports start hitting row limits.
Can Excel files feed a Google Sheets dashboard?
Yes. Excel or .xls files can be dropped into a Google Drive folder, and an Apps Script job can convert and append them to a Sheet that Data Studio reads. That removes the manual copy and paste step.
Why did my Sheets-based report break after someone edited the sheet?
Data Studio reads each column header as a field name, so renaming, deleting or moving a header breaks charts that use it. Keeping a locked output tab that only automation writes to prevents this.
Who maintains the Apps Script after the dashboard is handed over?
Your team owns it. The script lives in your Google account, is commented line by line, and runs on a trigger you can pause or change. If an insurer or supplier changes its file format, the mapping usually needs a small update, which I can do as a fixed-scope fix.
Keep reading
Related pages
Get started
Tell me what the report has to answer
Send the question your team keeps asking and where the data lives today. I reply within one business day with how I would build it, which connectors it needs and what it would cost.
- Free 30-minute review of your data and reports
- A fixed price before any work starts
- Built in your Google account, so you own everything
Prefer email? harsh@greenwolftechlabs.com
Book a free review
Two lines is enough to start.