BigQuery reporting
BigQuery Data Studio reporting that stays fast and keeps query costs in check
BigQuery Data Studio reporting is the step teams take when spreadsheets get too slow, GA4 quotas keep failing, or the data simply gets too big. I design the BigQuery tables and Data Studio data sources together for analysts, founders and marketing teams, so reports load quickly and the monthly query bill stays predictable.
Quick answer
How do I connect BigQuery to Data Studio?
A BigQuery Data Studio connection takes a few minutes: add a data source, choose the native BigQuery connector, then pick a project, dataset and table or write custom SQL. Set credentials and the billing project, use date range parameters on partitioned tables, and build charts. Prepared, aggregated tables keep reports fast.
- Point Data Studio at prepared tables, not raw event exports, to control query cost.
- Partition by date and pass the report's date range into custom SQL.
- Scheduled queries refresh summary tables so dashboards do not rescan raw data.
- Conversational Analytics uses data agents built in BigQuery and published to Data Studio.
When does a Data Studio report need BigQuery underneath?
When the data outgrows what connectors and spreadsheets handle well. The usual signs are GA4 quota errors that persist after trimming pages, "too many rows" errors, blends that need more than five sources or a non-equality join, and Google Sheets that take a minute to open.
BigQuery also suits data that already lives in Google Cloud, such as the GA4 BigQuery export, a product database, or files from finance and operations loaded on a schedule. It is a flexible-schema source, so a table can use up to 100 dimensions and 100 metrics instead of the 10 and 20 allowed on GA4 and Google Ads.
How do you set up BigQuery Data Studio data sources the right way?
Build a reporting layer first, then connect Data Studio to it. Raw tables are for storage and modeling. Reports should read from small, purpose-built tables or views with clear names, one row per day per entity, and only the columns the charts need.
For each data source I decide three things: whether it reads a table or a custom SQL query, whose credentials it uses, and which project is billed for queries. Owner's credentials let viewers see data without their own BigQuery access, which is right for most business dashboards. Viewer's credentials are right when access must follow each person's own permissions.
Naming matters more than it sounds. A table called rpt_sales_daily with fields like order_date and net_revenue tells the next analyst exactly what it holds. Clear names also make calculated fields in Data Studio shorter, because the cleaning has already happened in SQL.
- Table sources for prepared, stable reporting tables.
- Custom SQL sources for logic that must react to report parameters.
- Views for shared definitions used by several reports.
- A dedicated billing project so reporting costs are visible on their own.
What you get
What I build
Scoped and quoted at a fixed price after a free review.
Reporting dataset
Partitioned and clustered BigQuery tables or views designed for the charts you need.
Scheduled queries
Daily or hourly jobs that refresh summary tables so dashboards never scan raw data on load.
Data Studio sources
Table and custom SQL sources with date parameters, credentials and billing project set deliberately.
GA4 export models
Flattened session and key event tables with your channel grouping, if you use the GA4 export.
Cost notes
A short note on what each report scans and where to look if query costs rise.
Dashboard and handover
The finished report, transferred to your account, with SQL documented in plain language.
How do partitioning and custom SQL keep BigQuery costs down?
BigQuery charges by data scanned, so the goal is to scan less on every chart load. Partition reporting tables by date, cluster them on the fields you filter most, and make sure each query only touches the partitions in the selected date range.
In a custom SQL data source, I use the report's date range parameters inside the WHERE clause, so a viewer looking at last week scans one week of data rather than three years. Without that, every filter change can rescan the whole table, and a busy dashboard can become the largest line on the cloud invoice.
Scheduled queries do the rest. Instead of letting dashboards aggregate millions of raw rows on every load, a scheduled query builds a daily summary table each morning. The report reads that summary, which is small, cheap and fast.
How do I use the GA4 BigQuery export in Data Studio?
Model it before you report on it. The GA4 export stores one row per event with nested parameters, which is precise but awkward to chart directly. I write SQL that flattens the parameters you need, builds sessions and key events, applies your channel grouping, and writes the result to partitioned daily tables.
The payoff is that GA4 reports stop depending on the Data API quota of 14,000 tokens per project per property per hour, and you can join web behavior to CRM, product or revenue data that GA4 never sees. The trade-off is query cost and the need for someone who reads SQL, which is why I document each model in plain language.
What is Conversational Analytics in Data Studio, and does it need BigQuery?
Conversational Analytics lets people ask questions of their data in plain language inside Data Studio, using data agents built in BigQuery and published to Data Studio. It became available to all users on April 16, 2026, and reached general availability on July 30, 2026.
The answers are only as good as the tables and descriptions behind the agent. Clean, well-named reporting tables with documented fields are the same foundation a good dashboard needs, so building the BigQuery layer properly prepares you for both.
What does a BigQuery-backed dashboard look like in practice?
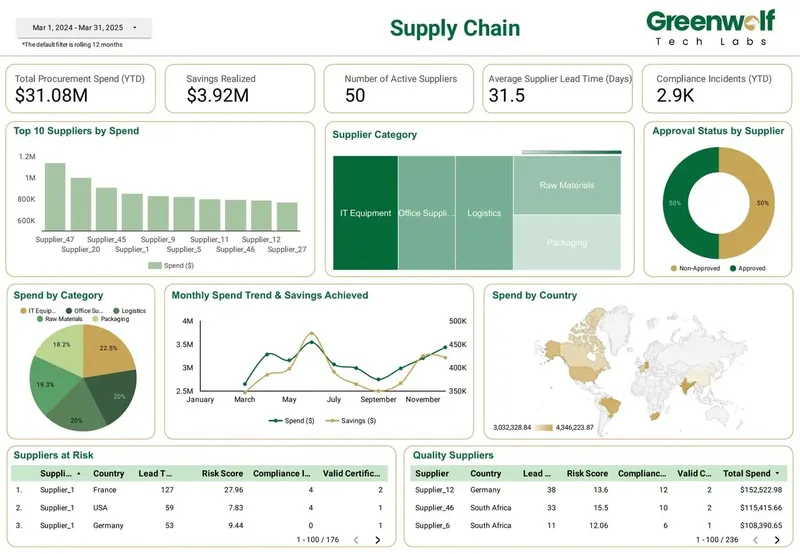
A supply chain and procurement dashboard I led at Greenwolf Tech Labs is a good example. It shows total procurement spend, savings realized, active suppliers, average supplier lead time, compliance incidents, top suppliers by spend, spend by category and by country, suppliers at risk, and approval status.
Data like that comes from several systems and many rows. Joining and cleaning it upstream, then exposing a few tidy tables to Data Studio, is what lets a procurement lead filter by country or category and get an answer in seconds instead of waiting on a spreadsheet.
How it works
How a project runs
- 01
Data review
I look at your BigQuery project, sources and current query costs.
- 02
Design and quote
I propose the reporting tables and pages, then send a fixed price.
- 03
Model
I write the SQL, partitioning and scheduled queries, and test the outputs.
- 04
Report
I build the Data Studio sources and pages on the new tables, with a live draft for review.
- 05
Hand over
You get ownership, documentation and a walkthrough of the SQL and the report.
FAQ
Frequently asked questions
Is connecting BigQuery to Data Studio free?
The connector is free and Data Studio is free. You pay BigQuery for the queries the reports run and the data you store. Partitioned tables, date-filtered custom SQL and scheduled summary tables keep that cost low.
Why is my BigQuery Data Studio report expensive?
Usually because charts query large raw tables, and every filter change scans them again. Pointing the report at partitioned summary tables and passing date range parameters into custom SQL typically reduces scanned data a lot.
Should I use a table or custom SQL as a Data Studio data source?
Use a table or view when the logic is stable and shared. Use custom SQL when the query must react to report parameters such as the date range. Many reports use both.
Whose credentials should a BigQuery data source use?
Owner's credentials let viewers see data without their own BigQuery permissions, which suits most business dashboards. Viewer's credentials enforce each person's own access, which suits sensitive data. The choice also affects which account is billed.
Do I need BigQuery for Conversational Analytics in Data Studio?
Yes. Conversational Analytics uses data agents built in BigQuery and published to Data Studio. It reached general availability on July 30, 2026.
Can BigQuery replace Google Sheets as my reporting source?
Often, yes, once data volume or the number of sources grows. Sheets can still be useful for small mapping tables and targets, which BigQuery can read alongside the main data.
Can you work inside my existing Google Cloud project?
Yes. I usually work in your own project with access granted through IAM, so tables, scheduled queries and billing stay under your control. If you have no project yet, I can help you set one up with a separate dataset for reporting.
Keep reading
Related pages
Get started
Tell me what the report has to answer
Send the question your team keeps asking and where the data lives today. I reply within one business day with how I would build it, which connectors it needs and what it would cost.
- Free 30-minute review of your data and reports
- A fixed price before any work starts
- Built in your Google account, so you own everything
Prefer email? harsh@greenwolftechlabs.com
Book a free review
Two lines is enough to start.