GA4 reporting
GA4 Data Studio dashboard that loads fast and matches what you see in GA4
A GA4 Data Studio dashboard is usually the first report a marketing team builds and the first one that breaks, with quota errors, mismatched numbers and charts that spin. I build GA4 reports for marketers, founders and analysts who want traffic, key events and search performance in one place, set up so they load quickly and agree with the GA4 interface.

Quick answer
How do I build a GA4 dashboard in Data Studio without quota errors?
A GA4 Data Studio dashboard avoids quota errors by sending fewer, smarter queries. Keep pages focused, reuse one GA4 data source, replace slow history with an extract or a BigQuery table, and limit charts that pull many dimensions. The GA4 Data API allows 14,000 tokens per project per property per hour on standard properties.
- GA4 quota errors come from many charts and viewers sharing one hourly token budget.
- Extracts or the GA4 BigQuery export take pressure off the live connector.
- Custom channel groupings in CASE statements make GA4 match how your team reports.
- Search Console data sits beside GA4 so organic clicks and key events share a page.
Why does my GA4 Data Studio dashboard show quota errors?
Because the GA4 connector draws from a shared token budget. On a standard GA4 property, the Data API allows 14,000 tokens per project per property per hour. Every chart on every page sends its own query, and every viewer who opens the report or changes a filter sends more. A twelve-chart page opened by a team of fifteen on Monday morning can use up the budget quickly.
The fix is rarely one setting. It is a mix of fewer queries per page, cheaper queries per chart, and moving history out of the live connector.
- Split long pages so each one loads only the charts it needs.
- Reuse a single GA4 data source instead of one per chart or per page.
- Drop rarely used dimensions from big tables, which cost more tokens to query.
- Use an extract for history that does not change, refreshed on a schedule.
- For heavy use, query the GA4 BigQuery export instead of the API.
What should a GA4 dashboard actually show?
A useful GA4 dashboard answers three questions: where visitors came from, what they did, and which sources produced key events. Everything else is detail for a second page.
My usual structure is an overview with sessions, engaged sessions, key events and revenue against the previous period; an acquisition page by channel, source and campaign; a content page showing landing pages and their key event rate; and an ecommerce or lead page if you track purchases or form submissions. Each page has the same date range and channel controls so viewers do not get lost.
Key events (the GA4 term that replaced conversions) need care. If you mark a page view or a scroll as a key event, the dashboard will count it alongside purchases. I check which events are marked before building, because a dashboard is only as honest as the GA4 configuration underneath it.
What you get
What I build
Scoped and quoted at a fixed price after a free review.
GA4 audit note
A short check of key events, channel groupings, filters and thresholding before the build starts.
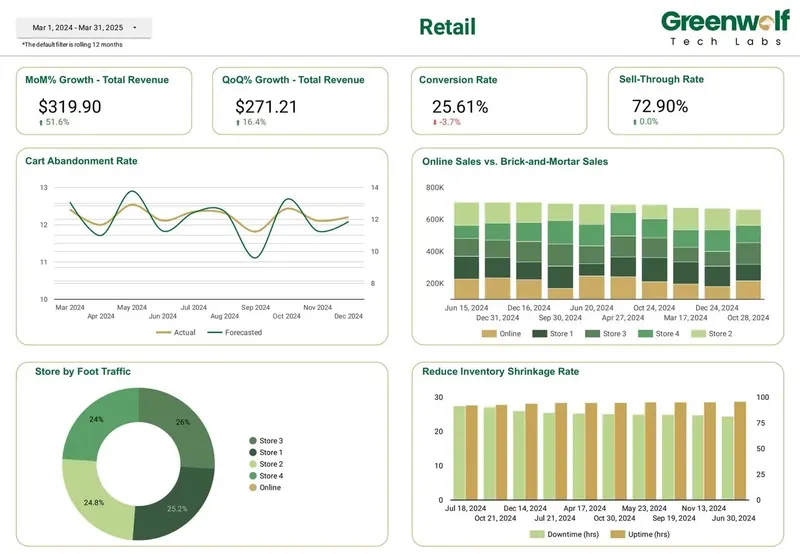
Multi-page GA4 dashboard
Overview, acquisition, content and conversion pages with shared date and channel controls.
Custom channel grouping
A CASE-based channel field reused across GA4, Google Ads and Search Console sources.
Search Console page
Queries and landing pages blended with GA4 key events on a normalized URL key.
Quota plan
Extracts or BigQuery tables in place where the live connector would run out of tokens.
How do custom channel groupings work in a GA4 Data Studio dashboard?
GA4's default channel grouping often lumps paid social, partner links and newsletters into categories your team does not use. I rebuild the grouping in a calculated field with a CASE statement on session source, medium and campaign, so the report uses your own channel names.
The calculated field approach has a second benefit. The same logic can be copied to the Google Ads and Search Console data sources, so a channel called "Paid Search" means exactly the same thing on every page. If you also configure custom channel groups inside GA4, I align the two so they never disagree.
Can I blend Search Console with GA4 in Data Studio?
Yes, and it is one of the most requested pages I build. Search Console tells you impressions, clicks, average position and queries. GA4 tells you what those visitors did after landing. Put together on landing page, they show which pages rank and also produce key events.
The catch is the join. Blends use equality joins only, so the landing page in GA4 and the URL in Search Console must match exactly. Search Console reports full URLs, while GA4 usually reports a path. I normalize both with calculated fields, strip query strings and trailing slashes, and then blend. Without that step, the blended table quietly drops most rows.
Remember that a blend joins at most five sources and lives inside one report. For larger SEO reporting across many sites, joining the data in BigQuery first is usually the cleaner route.
Why don't my GA4 Data Studio numbers match the GA4 interface?
Usually because the report and the interface are asking slightly different questions. Common causes are a different date range or time zone, a filter on the data source that nobody remembers adding, sessions compared with users, or a table that mixes dimensions with different scopes such as event-level and session-level fields.
Thresholding can also hide rows when Google signals is enabled, and some dimension combinations are simply not compatible in the GA4 API. I document each difference I find and either fix it or label it on the report, so nobody spends another meeting arguing about which number is right.
When should a GA4 report move to BigQuery?
Move when quota errors persist after trimming pages, when you need event-level detail the API does not expose, or when you need history beyond what the API returns quickly. The GA4 BigQuery export gives you raw events you can model once and reuse across reports.
It adds query cost and needs SQL, so it is not the default for every team. For a single site with a modest audience, a well-structured connector report with extracts is usually enough.
How it works
How a project runs
- 01
Property check
I review the GA4 property, key events and data streams with view access.
- 02
Scope and quote
We agree pages and metrics, and I send a fixed price.
- 03
Build and normalize
I build the data sources, channel logic and URL normalization, then the pages.
- 04
Load test
I open the report as several viewers to confirm it loads without quota errors.
- 05
Handover
You get ownership, documentation and a recorded walkthrough.
FAQ
Frequently asked questions
What is the GA4 quota limit in Data Studio?
On a standard GA4 property, the Data API allows 14,000 tokens per project per property per hour. Each chart query uses tokens, so busy reports with many charts and viewers can run out. Splitting pages, using extracts and moving to the BigQuery export all reduce the load.
Is there a free GA4 dashboard template for Data Studio?
Yes, there are free templates, and they work for a quick overview of one property. They use the default channel grouping and standard fields, so they rarely match how a team reports. Custom work is worth it when you need your own channels, key events or Search Console data alongside GA4.
Can one Data Studio dashboard show several GA4 properties?
Yes. You can add each property as a data source, or blend up to five of them on shared dimensions like date and channel. For many properties, combining them in BigQuery first is more reliable and avoids hitting quota on each one.
Why is my GA4 dashboard in Data Studio so slow?
Usually because each page sends many live API queries with lots of dimensions. Trimming tables, splitting pages and using extracts for history typically makes a noticeable difference. Very large reports may need the GA4 BigQuery export underneath.
Do I need GA4 admin access for you to build the dashboard?
Viewer access is enough to build most reports. To check or change key events and custom channel groups inside GA4, editor access helps, but I can also give your admin a short list of changes to make.
Can you add Google Ads cost to my GA4 dashboard?
Yes. If Google Ads is linked to GA4, some cost data is available directly, and I can also connect Google Ads as its own source. I use the same channel grouping logic on both so spend and key events line up.
Keep reading
Related pages
Get started
Tell me what the report has to answer
Send the question your team keeps asking and where the data lives today. I reply within one business day with how I would build it, which connectors it needs and what it would cost.
- Free 30-minute review of your data and reports
- A fixed price before any work starts
- Built in your Google account, so you own everything
Prefer email? harsh@greenwolftechlabs.com
Book a free review
Two lines is enough to start.